September 16th, 2011 by Karen Grace-Martin
Of all the concepts I see researchers struggle with as they start to learn high-level statistics, the one that seems to most often elicit the blank stare of incomprehension is the Covariance Matrix, and its friend, the Covariance Structure.
And since understanding them is fundamental to a number of statistical analyses, particularly Mixed Models and Structural Equation Modeling, it’s an incomprehension you can’t afford.
So I’m going to explain what they are and how they’re not so different from what you’re used to. I hope you’ll see that once you get to know them, they aren’t so scary after all.
What is a Covariance Matrix?
There are two concepts inherent in a covariance matrix–covariance and matrix. Either one can throw you off.
Let’s start with matrix. If you never took linear algebra, the idea of matrices can be frightening. (And if you still are in school, I highly recommend you take it. Highly). And there are a lot of very complicated, mathematical things you can do with matrices.
But you, a researcher and data analyst, don’t need to be able to do all those complicated processes to your matrices. You do need to understand what a matrix is, be able to follow the notation, and understand a few simple matrix processes, like multiplication of a matrix by a constant.
The thing to keep in mind when it all gets overwhelming is a matrix is just a table. That’s it.
A Covariance Matrix, like many matrices used in statistics, is symmetric. That means that the table has the same headings across the top as it does along the side.
Start with a Correlation Matrix
The simplest example, and a cousin of a covariance matrix, is a correlation matrix. It’s just a table in which each variable is listed in both the column headings and row headings, and each cell of the table (i.e. matrix) is the correlation between the variables that make up the column and row headings. Here is a simple example from a data set on 62 species of mammal:
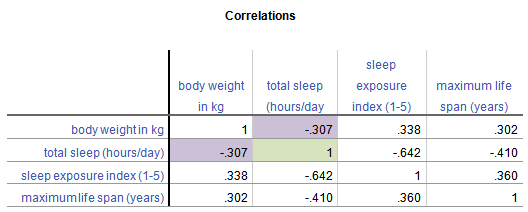
From this table, you can see that the correlation between Weight in kg and Hours of Sleep, highlighted in purple, is -.307. Smaller mammals tend to sleep more.
You’ll notice that this is the same above and below the diagonal. The correlation of Hours of Sleep with Weight in kg is the same as the correlation between Weight in kg and Hours of Sleep.
Likewise, all correlations on the diagonal equal 1, because they’re the correlation of each variable with itself.
If this table were written as a matrix, you’d only see the numbers, without the column headings.
Now, the Covariance Matrix
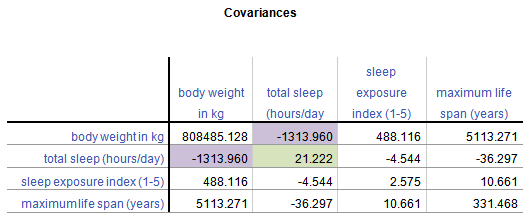
A Covariance Matrix is very similar. There are really two differences between it and the Correlation Matrix. It has this form:

First, we have substituted the correlation values with covariances.
Covariance is just an unstandardized version of correlation. To compute any correlation, we divide the covariance by the standard deviation of both variables to remove units of measurement. So a covariance is just a correlation measured in the units of the original variables.
Covariance, unlike correlation, is not constrained to being between -1 and 1. But the covariance’s sign will always be the same as the corresponding correlation’s. And a covariance=0 has the exact same meaning as a correlation=0: no linear relationship.
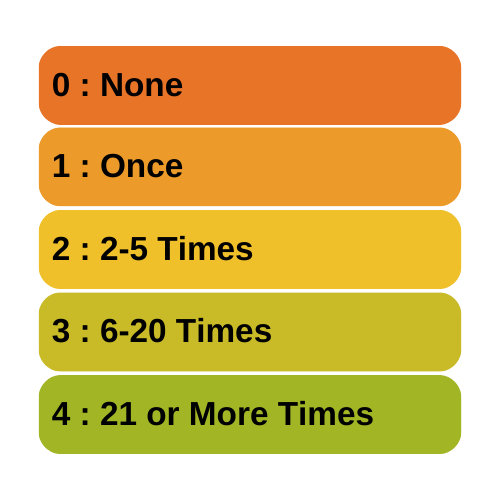
Because covariance is in the original units of the variables, variables on scales with bigger numbers and with wider distributions will necessarily have bigger covariances. So for example, Life Span has similar correlations to Weight and Exposure while sleeping, both around .3.
But values of Weight vary a lot (this data set contains both Elephants and Shrews), whereas Exposure is an index variable that ranges from only 1 to 5. So Life Span’s covariance with Weight (5113.27) is much larger than than with Exposure (10.66).
Second, the diagonal cells of the matrix contain the variances of each variable. A covariance of a variable with itself is simply the variance. So you have a context for interpreting these covariance values.
Once again, a covariance matrix is just the table without the row and column headings.
What about Covariance Structures?
Covariance Structures are just patterns in covariance matrices. Some of these patterns occur often enough in some statistical procedures that they have names.
You may have heard of some of these names–Compound Symmetry, Variance Components, Unstructured, for example. They sound strange because they’re often thrown about without any explanation.
But they’re just descriptions of patterns.
For example, the Compound Symmetry structure just means that all the variances are equal to each other and all the covariances are equal to each other. That’s it.
It wouldn’t make sense with our animal data set because each variable is measured on a different scale. But if all four variables were measured on the same scale, or better yet, if they were all the same variable measured under four experimental conditions, it’s a very plausible pattern.
Variance Components just means that each variance is different, and all covariances=0. So if all four variables were completely independent of each other and measured on different scales, that would be a reasonable pattern.
Unstructured just means there is no pattern at all. Each variance and each covariance is completely different and has no relation to the others.
There are many, many covariance structures. And each one makes sense in certain statistical situations. Until you’ve encountered those situations, they look crazy. But each one is just describing a pattern that makes sense in some situations.
July 22nd, 2011 by Karen Grace-Martin
Need to dummy code in a Cox regression model?
Interpret interactions in a logistic regression?
Add a quadratic term to a multilevel model?
 This is where statistical analysis starts to feel really hard. You’re combining two difficult issues into one.
You’re dealing with both a complicated modeling technique at Stage 3 (survival analysis, logistic regression, multilevel modeling) and tricky effects in the model (dummy coding, interactions, and quadratic terms).
The only way to figure it all out in a situation like that is to break it down into parts. (more…)
October 14th, 2009 by Karen Grace-Martin
Like any applied skill, mastering statistical analysis requires:
1. building a body of knowledge
2. adeptness of the tools of the trade (aka software package)
3. practice applying the knowledge and using the tools in a realistic, meaningful context.
If you think of other high-level skills you’ve mastered in your life–teaching, survey design, programming, sailing, landscaping, anything–you’ll realize the same three requirements apply.
These three requirements need to be developed over time–over many years to attain mastery. And they need to be developed together. Having more background knowledge improves understanding of how the tools work, and helps the practice go better. Likewise, practice in a real context (not perfect textbook examples) makes the knowledge make more sense, and improves skills with the tools.
I don’t know if this is true of other applied skills, but from what I’ve seen over many years of working with researchers as they master statistical analysis, the journey seems to have 3 stages. Within each stage, developing all 3 requirements–knowledge, tools, and experience–to a level of mastery sets you up well for the next stage. (more…)
February 9th, 2009 by Karen Grace-Martin
There are two reasons to center predictor variables in any type of regression analysis–linear, logistic, multilevel, etc.
1. To lessen the correlation between a multiplicative term (interaction or polynomial term) and its component variables (the ones that were multiplied).
2. To make interpretation of parameter estimates easier.
I was recently asked when is centering NOT a good idea? (more…)
November 17th, 2008 by Karen Grace-Martin
A great article for specifying Mixed Models in SAS:
Mixed up Mixed Models
by Robert Harner & P.M. Simpson
Anyone doing mixed modeling in SAS should read this paper, originally presented at SUGI: SAS Users Group International conference. It compares the output from Proc Mixed and Proc GLM when specified different ways. There are some subtle distinctions in the meaning of the defaults in the Repeated and Random statements, and this paper does an excellent job of clarifying them.
January 21st, 2008 by Karen Grace-Martin
 Level is a statistical term that is confusing because it has multiple meanings in different contexts (much like alpha and beta).
There are three different uses of the term Level in statistics that mean completely different things. What makes this especially confusing is that all three of them can be used in the exact same analysis context.
I’ll show you an example of that at the end.
So when you’re talking to someone who is learning statistics or who happens to be thinking of that term in a different context, this gets especially confusing.
Levels of Measurement
 The most widespread of these is levels of measurement. Stanley Stevens came up with this taxonomy of assigning numerals to variables in the 1940s. You probably learned about them in your Intro Stats course: the nominal, ordinal, interval, and ratio levels.
Levels of measurement is really a measurement concept, not a statistical one. It refers to how much and the type of information a variable contains. Does it indicate an unordered category, a quantity with a zero point, etc?
So if you hear the following phrases, you’ll know that we’re using the term level to mean measurement level:
- nominal level
- ordinal level
- interval level
- ratio level
It is important in statistics because it has a big impact on which statistics are appropriate for any given variable. For example, you would not do the same test of association between two variables measured at a nominal level as you would between two variables measured at an interval level.
That said, levels of measurement aren’t the only information you need about a variable’s measurement. There is, of course, a lot more nuance.
Levels of a Factor
Another common usage of the term level is within experimental design and analysis. And this is for the levels of a factor. Although Factor itself has multiple meanings in statistics, here we are talking about a categorical independent variable.
In experimental design, the predictor variables (also often called Independent Variables) are generally categorical and nominal. They represent different experimental conditions, like treatment and control conditions.
Each of these categorical conditions is called a level.
Here are a few examples:
- In an agricultural study, a fertilizer treatment variable has three levels: Organic fertilizer (composted manure); High concentration of chemical fertilizer; low concentration of chemical fertilizer.So you’ll hear things like: “we compared the high concentration level to the control level.”
- In a medical study, a drug treatment has three levels: Placebo; standard drug for this disease; new drug for this disease.
- In a linguistics study, a word frequency variable has two levels: high frequency words; low frequency words.
Now, you may have noticed that some of these examples actually indicate a high or low level of something. I’m pretty sure that’s where this word usage came from. But you’ll see it used for all sorts of variables, even when they’re not high or low.
Although this use of level is very widespread, I try to avoid it personally. Instead I use the word “value” or “category” both of which are accurate, but without other meanings. That said, “level” is pretty entrenched in this context.
Level in Multilevel Models or Multilevel Data
A completely different use of the term is in the context of multilevel models. Multilevel models is a 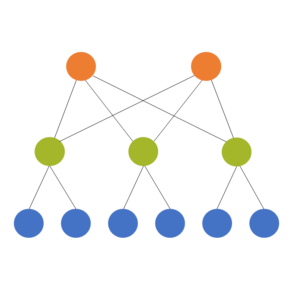 term for some mixed models. (The terms multilevel models and mixed models are often used interchangably, though mixed model is a bit more flexible).
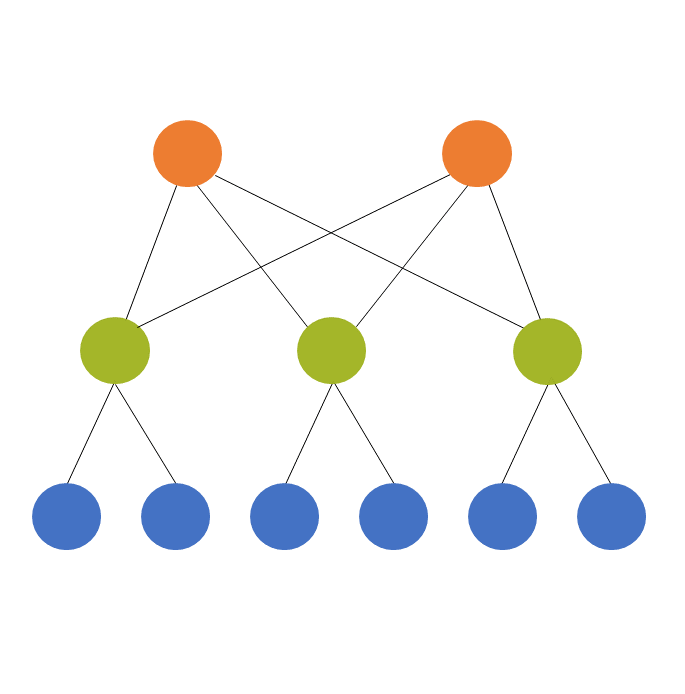
Multilevel models are used for multilevel (also called hierarchical or nested) data, which is where they get their name. The idea is that the units we’ve sampled from the population aren’t independent of each other. They’re clustered in such a way that their responses will be more similar to each other within a cluster.
The models themselves have two or more sources of random variation. A two level model has two sources of random variation and can have predictors at each level.
A common example is a model from a design where the response variable of interest is measured on students. It’s hard though, to sample students directly or to randomly assign them to treatments, since there is a natural clustering of students within schools.
So the resource-efficient way to do this research is to sample students within schools.
Predictors can be measured at the student level (eg. gender, SES, age) or the school level (enrollment, % who go on to college). The dependent variable has variation from student to student (level 1) and from school to school (level 2).
We always count these levels from the bottom up. So if we have students clustered within classroom and classroom clustered within school and school clustered within district, we have:
- Level 1: Students
- Level 2: Classroom
- Level 3: School
- Level 4: District
So this use of the term level describes the design of the study, not the measurement of the variables or the categories of the factors.
Putting them together
So this is the truly unfortunate part. There are situations where all three definitions of level are relevant within the same statistical analysis context.
I find this unfortunate because I think using the same word to mean completely different things just confuses people. But here it is:
Picture that study in which students are clustered within school (a two-level design). Each school is assigned to use one of three math curricula (the independent variable, which happens to be categorical).
So, the variable “math curriculum” is a factor with three levels (ie, three categories).
Because those three categories of “math curriculum” are unordered, “math curriculum” has a nominal level of measurement.
And since “math curriculum” is assigned to each school, it is considered a level 2 variable in the two-level model.
See the rest of the Confusing Statistical Terms series.
First published December 12, 2008
Last Updated January 21, 2025