One of those tricky, but necessary, concepts in statistics is the difference between crossed and nested factors.
As a reminder, a factor is any categorical independent variable. In experiments, or any randomized designs, these factors are often manipulated. Experimental manipulations (like Treatment vs. Control) are factors.
Observational categorical predictors, such as gender, time point, poverty status, etc., are also factors. Whether the factor is observational or manipulated won’t affect the analysis, but it will affect the conclusions you draw from the results.
(more…)
Are you learning Multilevel Models? Do you feel ready? Or in over your head?
It’s a very common analysis to need to use. I have to say, learning it is not so easy on your own. The concepts of random effects are hard to wrap your head around and there is a ton of new vocabulary and notation. Sadly, this vocabulary and notation is not consistent across articles, books, and software, so you end up having to do a lot of translating.
(more…)
When you hear about multilevel models or mixed models, you very often think of a nested design. Level 1 units  nested in Level 2 units, which are in turn possibly nested in Level 3 units. But these variables that define the units and that become random factors in the model can, in fact, be crossed with each other, not nested.
Mixed models with crossed random factors are a little trickier to wrap your head around than mixed models with nested random factors. They still involve some nesting. But they’re not harder to analyze and they are quite common in many fields. Recognizing when you have one and knowing how to analyze the data when you do are important statistical skills.
The Nested Multilevel Design
Let’s start by reviewing the more common design: nested. The most straightforward use of Mixed Models is when observations are clustered or nested in some higher group.
It’s also so common that it often has its own name: multilevel model.
Examples include studies where patients share the same doctor, plants grow in the same field, or participants respond to multiple experimental conditions.
The units of observation at Level 1 (patient, plant, response) are clustered at Level 2 (doctor, field, or participant). This makes the responses from the same cluster correlated.
In these models, the Level 2 cluster is not something you’re interested in testing hypotheses about. It’s what we call a “blocking factor.” Even so, you need to control for its effects.
If the researcher would like to generalize the results to all doctors, fields, or participants, these clustering variables are random factors. You account for and measure its effects through random intercepts and/or adding random slopes across this factor for any level 1 predictor.
The observations of the dependent variable are always measured on the Level 1 unit (the patient, plant, or time point). Predictor variables (fixed effects) can be measured at either Level 1 or Level 2. For example, number of years of experience of a doctor would be at Level 2, measured for each doctor. But patient age would be measured at Level 1, measured for each patient.
You assume the values of the response variable within cluster are are correlated, but the observations between clusters are independent.
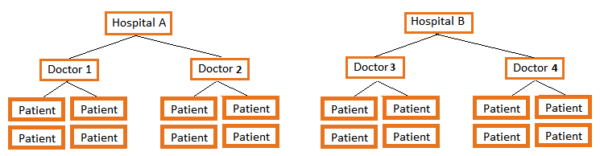
A third level (or more) is possible as well. This would happen if each doctor sees all their patients at one of four hospitals or each field has only one of 5 species.
The Crossed Multilevel Design
In one kind of 2-level design, there is not one random factor at Level 2, but two crossed factors. Each is a different random factor and they’re crossed with each other.
Each observation at Level 1 is nested in the combination of these two random factors. These models need to be specified correctly to capture the effects of both random factors at Level 2.
Here are the same examples with crossed random factors:
Example 1:
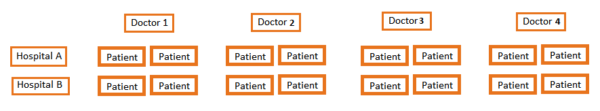
Every patient (Level 1) sees their Doctor (Random Factor at Level 2) at one of four Hospitals (Random Factor at Level 2) for a study comparing a new drug treatment for diabetes to an old one.
Each doctor sees patients at each of the hospitals. That means Hospital and Doctor are crossed. (If each doctor worked at only one hospital, doctor would be nested within Hospital). Patient responses vary across doctors and hospitals.
Because each Patient sees a single doctor at a single hospital, patients are nested in the combination of Doctor and Hospital.
The response is measured at Level 1–the patient. Predictors can occur at Level 1 (age, diet) or either Level 2 factor (years of practice by doctor, size of hospital).
The analysis would need to include, at a minimum, a random intercept for Doctor and a random intercept for Hospital.
Example 2:
An agricultural study is studying plants in 6 fields.
While there are many species of plants in each field, the researcher randomly chooses 5 species to be in the study. Each of the 5 species is found in every field.
Each individual plant (Level 1 unit) grows within one combination of species and field. Since every species is in every field, Species and Field are crossed at Level 2.
The response (nitrogen uptake) is measured at Level 1–the plant. Predictors can occur at Level 1 (height of plant) or either Level 2 factor (type of fertilizers applied to the field, whether the species is native or introduced).
Example 3:
In a social psychology experiment on first impressions, subjects rate statements that describe behaviors done by a fictional person, Bob.
On each trial, subjects rate whether or not they find Bob’s behavior friendly. The response time of the rating is recorded. Trial is the Level 1 unit.
Each subject sees the same 10 friendly and 10 unfriendly behaviors. The behaviors are not in themselves of interest to the experimenter, but are representative of all friendly and unfriendly behaviors that Bob could perform.
Because responses to the same behavior tend to be similar, it is necessary to control for their effects. After all, even within friendly behaviors, some (giving a gift) may be generally rated more friendly than others (holding a door open). Each trial of the experiment (Level 1) is nested within the combination of Subject and Behavior, which are both random factors at Level 2.
Subject and Behavior are crossed at Level 2 since every Subject rates every Behavior. The response is measured at Level 1–the trial. Predictors can occur at Level 1 (a distractor occurs on some trials) or either Level 2 factor (Behavior is friendly or not, Subject is put into positive, neutral, or negative mood).
Analysis issues
Luckily, standard mixed modeling procedures such as SAS Proc Mixed, SPSS Mixed, Stat’s mixed, or R’s lmer can all easily run a mixed model with crossed effects model. (R’s lme can’t do it).
However, I’ve also seen issues with software that is designed specifically for Multilevel (aka Nested) designs. It assumes that all random factors are nested within each other. For example, a member was once trying to use a software designed for estimating sample sizes in multilevel models. It would only allow one random factor at level 2. So that software just didn’t work for that design.
At a minimum, each random factor needs a random intercept. The random factor itself is defined as the “subject” in the random part of the mixed model. You need two. You don’t need to specify to the software that the two random factors are crossed. With the data in long format, your software can tell.
Where it gets tricky is when deciding which random slopes you can include in the model. Each random factor can potentially have random slopes in addition to random intercepts. But this depends on the specific design of the study.
And of course, a study design can get even more complex. You could have more than the two random factors than we’ve talked about here. And they can be crossed or nested with each other.
Updated 10/2023
What is the difference between Clustered, Longitudinal, and Repeated Measures Data? You can use mixed models to analyze all of them. But the issues involved and some of the specifications you choose will differ.
Just recently, I came across a nice discussion about these differences in West, Welch, and Galecki’s (2007) excellent book, Linear Mixed Models.
It’s a common question. There is a lot of overlap in both the study design and in how you analyze the data from these designs.
West et al give a very nice summary of the three types. Here’s a paraphrasing of the differences as they explain them:
- In clustered data, the dependent variable is measured once for each subject, but the subjects themselves are somehow grouped (student grouped into classes, for example). There is no ordering to the subjects within the group, so their responses should be equally correlated.
- In repeated measures data, the dependent variable is measured more than once for each subject. Usually, there is some independent variable (often called a within-subject factor) that changes with each measurement.
- In longitudinal data, the dependent variable is measured at several time points for each subject, often over a relatively long period of time.
A Few Observations
West and colleagues also make the following good observations:
1. Dropout is usually not a problem in repeated measures studies, in which all data collection occurs in one sitting. It is a huge issue in longitudinal studies, which usually require multiple contacts with participants for data collection.
2. Longitudinal data can also be clustered. If you follow those students for two years, you have both clustered and longitudinal data. You have to deal with both.
3. It can be hard to distinguish between repeated measures and longitudinal data if the repeated measures occur over time. [My two cents: A pre/post/followup design is a classic example].
4. From an analysis point of view, it doesn’t really matter which one you have. All three are types of hierarchical, nested, or multilevel data. You would analyze them all with some sort of mixed or multilevel analysis. You may of course have extra issues (like dropout) to deal with in some of these.
My Own Observations
I agree with their observations, and I’d like to add a few from my own experience.
1. Repeated measures don’t have to be repeated over time. They can be repeated over space (the right knee gets the control operation and the left knee gets the experimental operation). They can also be repeated over condition (each subject gets both the high and low cognitive load condition. Longitudinal studies are pretty much always over time.
This becomes an issue mainly when you are choosing a covariance structure for the within-subject residuals (as determined by the Repeated statement in SAS’s Proc Mixed or SPSS Mixed). An auto-regressive structure is often needed when some repeated measurements are closer to each other than others (over either time or space). This is not an issue with purely clustered data, since there is no order to the observations within a cluster.
2. Time itself is often an important independent variable in longitudinal studies, but in repeated measures studies, it is usually confounded with some independent variable.
When you’re deciding on an analysis, it’s important to think about the role of time. Time is not important in an experiment, where each measurement is a different condition (with order often randomized). But it’s very important in a study designed to measure changes in a dependent variable over the course of 3 decades.
3. Time may be measured with some proxy like Age or Order. But it’s still really about time.
4. A longitudinal study does not have to be over years. You could be measuring reaction time every second for a minute. In cases like this, dropout isn’t an issue, although time is an important predictor.
5. Consider whether it makes sense to think about time as continuous or categorical. If you have only two time points, even if you have numerical measurements for them, there is no point in treating it as continuous. You need at least three time points to fit a line, but more is always better.
6. Longitudinal data can be analyzed with many statistical methods, including structural equation modeling and survival analysis. You only use multilevel modeling if the dependent variable is measured repeatedly and if the point of the model is to see how it changes (or differs).
Naming a data structure, design, or analysis is most helpful if it is so specific that it defines yours exactly. Your repeated measures analysis may not be like the repeated measures example you’re trying to follow. Rather than trying to name the analysis or the data structure, think about the issues involved in your design, your hypotheses, and your data. Work with them accordingly.
Go to the next article or see the full series on Easy-to-Confuse Statistical Concepts
One of the difficult decisions in mixed modeling is deciding which factors are fixed and which are random. And as difficult as it is, it’s also very important. Correctly specifying the fixed and random factors of the model is vital to obtain accurate analyses.
Now, you may be thinking of the fixed and random effects in the model, rather than the factors themselves, as fixed or random. If so, remember that each term in the model (factor, covariate, interaction or other multiplicative term) has an effect. We’ll come back to how the model measures the effects for fixed and random factors.
Sadly, the definitions in many texts don’t help much with decisions to specify factors as fixed or random. Textbook examples are often artificial and hard to apply to the real, messy data you’re working with.
Here’s the real kicker. The same factor can often be fixed or random, depending on the researcher’s objective. (more…)
 Hessian (or G or D) Matrix is not positive definite. Convergence has stopped.”