Of all the concepts I see researchers struggle with as they start to learn high-level statistics, the one that seems to most often elicit the blank stare of incomprehension is the Covariance Matrix, and its friend, the Covariance Structure.
And since understanding them is fundamental to a number of statistical analyses, particularly Mixed Models and Structural Equation Modeling, it’s an incomprehension you can’t afford.
So I’m going to explain what they are and how they’re not so different from what you’re used to. I hope you’ll see that once you get to know them, they aren’t so scary after all.
What is a Covariance Matrix?
There are two concepts inherent in a covariance matrix–covariance and matrix. Either one can throw you off.
Let’s start with matrix. If you never took linear algebra, the idea of matrices can be frightening. (And if you still are in school, I highly recommend you take it. Highly). And there are a lot of very complicated, mathematical things you can do with matrices.
But you, a researcher and data analyst, don’t need to be able to do all those complicated processes to your matrices. You do need to understand what a matrix is, be able to follow the notation, and understand a few simple matrix processes, like multiplication of a matrix by a constant.
The thing to keep in mind when it all gets overwhelming is a matrix is just a table. That’s it.
A Covariance Matrix, like many matrices used in statistics, is symmetric. That means that the table has the same headings across the top as it does along the side.
Start with a Correlation Matrix
The simplest example, and a cousin of a covariance matrix, is a correlation matrix. It’s just a table in which each variable is listed in both the column headings and row headings, and each cell of the table (i.e. matrix) is the correlation between the variables that make up the column and row headings. Here is a simple example from a data set on 62 species of mammal:
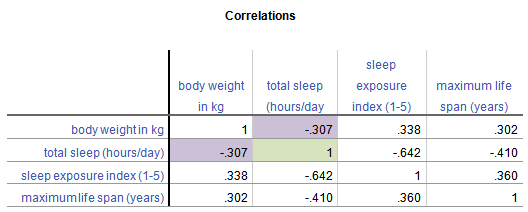
From this table, you can see that the correlation between Weight in kg and Hours of Sleep, highlighted in purple, is -.307. Smaller mammals tend to sleep more.
You’ll notice that this is the same above and below the diagonal. The correlation of Hours of Sleep with Weight in kg is the same as the correlation between Weight in kg and Hours of Sleep.
Likewise, all correlations on the diagonal equal 1, because they’re the correlation of each variable with itself.
If this table were written as a matrix, you’d only see the numbers, without the column headings.
Now, the Covariance Matrix
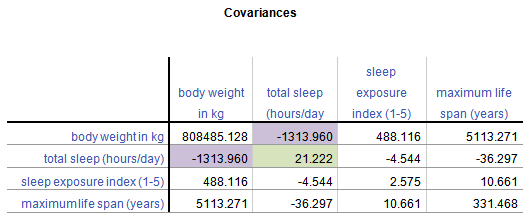
A Covariance Matrix is very similar. There are really two differences between it and the Correlation Matrix. It has this form:

First, we have substituted the correlation values with covariances.
Covariance is just an unstandardized version of correlation. To compute any correlation, we divide the covariance by the standard deviation of both variables to remove units of measurement. So a covariance is just a correlation measured in the units of the original variables.
Covariance, unlike correlation, is not constrained to being between -1 and 1. But the covariance’s sign will always be the same as the corresponding correlation’s. And a covariance=0 has the exact same meaning as a correlation=0: no linear relationship.
Because covariance is in the original units of the variables, variables on scales with bigger numbers and with wider distributions will necessarily have bigger covariances. So for example, Life Span has similar correlations to Weight and Exposure while sleeping, both around .3.
But values of Weight vary a lot (this data set contains both Elephants and Shrews), whereas Exposure is an index variable that ranges from only 1 to 5. So Life Span’s covariance with Weight (5113.27) is much larger than than with Exposure (10.66).
Second, the diagonal cells of the matrix contain the variances of each variable. A covariance of a variable with itself is simply the variance. So you have a context for interpreting these covariance values.
Once again, a covariance matrix is just the table without the row and column headings.
What about Covariance Structures?
Covariance Structures are just patterns in covariance matrices. Some of these patterns occur often enough in some statistical procedures that they have names.
You may have heard of some of these names–Compound Symmetry, Variance Components, Unstructured, for example. They sound strange because they’re often thrown about without any explanation.
But they’re just descriptions of patterns.
For example, the Compound Symmetry structure just means that all the variances are equal to each other and all the covariances are equal to each other. That’s it.
It wouldn’t make sense with our animal data set because each variable is measured on a different scale. But if all four variables were measured on the same scale, or better yet, if they were all the same variable measured under four experimental conditions, it’s a very plausible pattern.
Variance Components just means that each variance is different, and all covariances=0. So if all four variables were completely independent of each other and measured on different scales, that would be a reasonable pattern.
Unstructured just means there is no pattern at all. Each variance and each covariance is completely different and has no relation to the others.
There are many, many covariance structures. And each one makes sense in certain statistical situations. Until you’ve encountered those situations, they look crazy. But each one is just describing a pattern that makes sense in some situations.

Fantanstic introduction.
Thanks a lot.
This is very useful for me in fostering my academic career.
Thank you, very readable post.
I agree with all the greetings to you for your very good explanation of covariance structures, and I will be happy to see you explain some of the more common like AR1 and ARH1, diagonal and scaled identity also. But I have a question – in reading e.g. Heck, Scott and Tabata (2014, sec ed) they are talking about residual structures in looking for the right covariance structure. How does their reasoning relate to your explanation?
Rolf, in the example above, the covariance matrix was for four different variables. But in a repeated measures context, one important covariance matrix is for the residuals for the repeated measures. So imagine each subject is measured at four time points. Those time points, and their residual values (after accounting for fixed effects) are likely to be correlated. So the covariances will be non-zero.
One of the most lucid explanations of covariance structures I have found. Should the sentence, “To compute any correlation, we divide the covariance by the standard deviation of both variables to remove units of measurement” be amended to “…divide the covariance by the product of the standard deviations of both variables…”?
Hi T Brady, it could. The order of operations in algebra will have it work out the same.
This is a sound and explicit explanation. You are an amazing teacher. Thank you!
Hi Karen
Thank you very much, the text very clear. I did not find the year of the text, in order to be able to quote it.
Cleber
Most grateful for such a clear explanation and for the generosity of making this and more available. Thank you. D.
wow!
This is a very informative forum for statistical concepts.
This was superb. Thank you for this!
Thank you this was very helpful!!!
I am working on python Gaussianhmm and need to calculate co-variance full type. I am able to get it. However I am curious how to calculate diag type co-variance matrix. Ay help..
Meanwhile, above article is very clear and concise.
Thank you Karen!!!! I have been looking for a succinct and clear explanation to the kinds of covariance structures for a few days. So glad I found this. Bravo!
You are my hero. Thank you for this explanation. I have been looking for something like this for weeks.
Many thanks for the simplified explanation. I hope you write something about eigenvalues.
Thanks you! This really make sense 🙂
Have read so many websites but everyone loves quoting books and theory. Loved the simplified explanation and fluidity and flow of the article. and thanks a lot…
You are a genius and a saint!
Thanks so much for those explanations. I’m studying third year stats in New Zealand and always loved stats but got lost recently with linear models and multivariate distributions. To break everything down makes it so much simpler to get to understand the big picture step by step. Thanks!
Thanks for a great article, I have a question though.
You said that the sign will be the same i.e like correlation matrices one factor might move in the opposite direction of the other in covariance, but covariance matrices are positive semi definite. I am a bit confused on this, can you please explain this point a bit.
I think you are confusing two issues.
The corresponding individual entries in the covariance matrix and correlation matrix will have the same sign because the correlation matrix is simply the covariance matrix divided by the standard deviations, which are always positive.
Both the correlation matrix and the covariance matrix are positive semi-definite, which means that their eigenvalues are all non-negative, which is not what she’s talking about here.
Big thanks Karen, this simple breakdown of the fundamental language of covariances helps make the more difficult material much easier to grasp!
I appreciate the time you took to write this. It’s very clear and helpful. I’d been reading about these things with glazed eyes, and now they make more sense. Thanks!
Thank you for this! You explained everything much more effectively than the author of my textbook.
Thanks so much. This really helped a lot.
Loved the way you explained covariance matrices.. Could you also give a brief description of the various covariance matrix types.. as in diagonal covariance matrix etc with their significance IN YOUR WONDERFUL WAY OF EXPLANATION? And could you suggest/ recommend some literature on training probability distribution models?
Thanks for the article on covariance matrix.. Saved me a lot of time reading incomprehensible books!
Kudos!
Where’s the bears?
Oh, they’re everywhere. 🙂
Hi, first of all thanks for this, second, if all four variables were measured on the same scale, is there a measure of how well they relate, like the Pearson product-moment correlation coeficient ? I saw this http://mathoverflow.net/questions/57998/correlation-between-3-variables but was looking for a general formula for N variables…
Hi Joao,
I know there is a multiple correlation coefficient, but I believe it relates multiple variables to a single outcome. So the relationship between multiple Xs to a single Y.
Perhaps a Chronbach’s alpha would work for you?
What an absolutely fantastic, succinct explanation. I think it is a mark of true understanding when you can explain complicated concepts so well.
Thanks, Craig.
Thanks for giving this explanation. I now understand the basic concept. I need to relate this to spatial covariance structure such spherical, exponential, gaussian, AR, power. And how to write out the matrix form. Could you provide me the link where I can undertsand this concept.
Moshood
Hi Moshood,
You don’t mention which stat software you use, but your manuals should give you an example of the form of the different covariance structures. Likewise, your software should be able to print out the estimated covariance matrix for you. Again, check the manual to see what option you need for that–it’s often not printed by default.
Hi!
Thanks for this! I often have to read through tons of material trying to decode things. I really enjoy sites such as this one where someone explains things elegantly leaving out the complex statistics! I am an epidemiologist not a statistician- let’s keep it that way! haha.
Thank you!
Thanks, Sam!
hi Agnes,
this is a well thought definition. i have always wondered what the structure means. thanks very much for the clarification.
thanks