A central concept in statistics is the level of measurement of a variable. It’s so important to everything you do with data that it’s usually taught within the first week in every intro stats class.
But even something so fundamental can be tricky once you start working with real data. The same variable can be considered to have different levels of measurement in different situations. It sounded like an absolute in that intro stats class because your wise professor didn’t want to confuse beginning students.
But now that you’re a more sophisticated practitioner of data analysis, I will show you how the same variable can be considered to have different levels of measurement. But first, let me review some definitions.
A Review of Variables’ Levels of Measurement
Nominal:
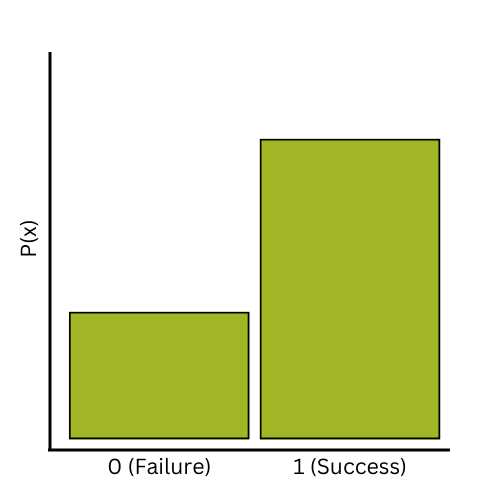
Unordered categorical variables. These can be either binary (only two categories, like gender: male or female) or multinomial (more than two categories, like marital status: married, divorced, never married, widowed, separated). The key thing here is that there is no logical order to the categories.
Ordinal:
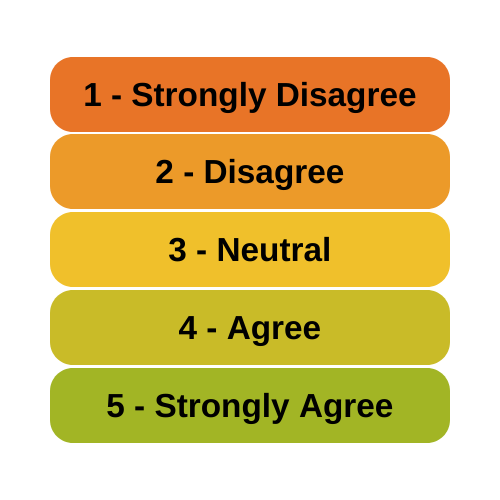
Ordered categories. Still categorical, but in an order. Likert items with responses like: “Never, Sometimes, Often, Always” are ordinal.
Interval:
Numerical values without a true zero point. The idea here is the intervals between the values are equal and meaningful, but the numbers themselves are arbitrary. 0 does not indicate a complete lack of the quantity being measured. IQ and degrees Celsius or Fahrenheit are both interval.
Ratio:
Numerical values with a true zero point.
Interval and Ratio variables can be further split into two types: discrete and continuous. Discrete variables, like counts, can only take on whole numbers: number of children in a family, number of days missed from work. Continuous variables can take on any number, even beyond the decimal point.
Not always obvious is that these levels of measurement are not only about the variable itself. Also important are the meaning of the variable within the research context and how it was measured.
An Example: Age
A great example of this is a variable like age. Age is, technically, continuous and ratio. A person’s age does, after all, have a meaningful zero point (birth) and is continuous if you measure it precisely enough. It is meaningful to say that someone (or something) is 7.28 year old.
That said, you may not be able to treat it as continuous in your analysis. It depends on how you measured it and whether there are qualitative implications about age in your research context. Here are 5 examples in which Age has another level of measurement:
Age as Ordinal
 For example, it’s not uncommon to give people age categories as possible responses on a survey. Common reasons are that people don’t want to reveal their actual age or because they don’t remember the actual age at which some event occurred.
I worked with a client whose dependent variable was the age at which adult smokers started smoking. It would have been great to get an accurate date on which each person smoked their first cigarette, but it’s a big burden on respondents to ask them a very specific number from a long time ago.
Rather than have respondents guess inaccurately or leave the answer blank, the researchers gave them a series of ordered age categories: 0 to 10, 11-12, 13-15, 16-17, etc. They gave up precision to gain accuracy.
Ordinal response variables require a model like an Ordinal Logistic Regression.
Age as Discrete Counts
![]() Likewise, a continuous variable may be rendered discrete because of the way people think about and measure it.
Likewise, a continuous variable may be rendered discrete because of the way people think about and measure it.
For example, consider the example of age measured in days on which germinated seeds of a specific species begin to sprout leaves. Most will do so within a few days, and it may range from 2-9 days.
In this context, age is definitely a discrete count—the number of days. If it is used as an outcome variable, a Poisson (or related) regression would be appropriate, not a linear model.
Age as Multinomial
Sometimes numerical variables are rendered categorical due to the lack of values.
In one study I analyzed, the key independent variable was the age of a witness in a trial. While technically, ages are continuous, in this study there were only four values: 49, 69, 79 and 89.
So even though one could use statistics that treated this variable as continuous, they don’t make a lot of sense. In a linear model, if you treat this age variable as a numerical predictor, the model will fit a regression line across these four ages. If you treat it as categorical, the will estimate means and allow you to compare the mean of Y at each age.
The effect of age in this context is better measured through a difference in the mean of Y at two different ages than through a slope—the difference in Y for each one year increase.
Now if your multinomial age variable is the response, you’ll need a multinomial logistic regression.
Age as Binary Categories
 In a similar example, a researcher was studying math abilities in first grade children. The key independent variable was whether the child had reached a specific cognitive developmental milestone and the dependent variable was math score. Age was a control variable and it was mildly related to, but not confounded with, attainment of the milestone.
Because each child was asked how old they were, it was measured in whole years. It would have been ideal to collect more specific data on ages—such as their birth dates from their parents or school records. For whatever reason, it wasn’t possible.
So the only two values for age were 6 and 7. So just like in the last example, it only made sense to treat this predictor variable as categorical in the analysis.
If you had a binary outcome variable, you’d most likely need a binary logistic regression.
Age as Binary Categories (another one)
In a study comparing the work-life balance of men and women, the outcome variable was number of hours worked per week. One key predictor for women, but not men, was the age of their youngest child.
There is a qualitative difference between a 5 year old, who may only be eligible for part-time kindergarten and a 6 year old, who is old enough to go to full-time school.
This qualitative difference exists in this context between 5 and 6 that doesn’t exist at other one-year age differences*. This qualitative difference is in fact the most important feature of the youngest child’s age. Treating age as continuous actually ignores this important qualitative difference.
Notice that both of these binary examples are very different situation from doing a median split on a continuous variable.
That kind of categorizing isn’t a good idea because you’re throwing away good information based on an arbitrary cutoff.
*It also doesn’t exist in other contexts. The difference between ages 5 and 6 wouldn’t be important if you’re studying drug use or retirement planning.
Hi Karen,
Thanks for this post. I had not considered the implicaton of age, when used as the dependent variable, is a discrete count, and thus warrants the use of a Poisson regression. Maybe I would have figured this out on my own if I ever used age as a dependent variable, but probably not. Thanks for recirculating this post!
Regards,
Jeff
Hi Karen-
This is a very thought provoking article. How does one handle data when it is expressed per unit of a different measurement?
Example: I collect number of prescriptions written in various clinics over a year period before and after an intervention. HOWEVER… because many of the clinics had variable numbers of visits, the standardized way to report this in my field is prescriptions per 100 visits.
I feel this is ratio data with an absolute 0 point and each clinic coming out with decimal points once prescriptions are divided by a number of visits (and continuous since any value is possible). When discussing this with a colleague, they point out that this is more like ordinal data… no one writes 1.47 prescriptions in a visit. It doesn’t matter that I express this per 100 visits, it will still be ordinal because that’s how it was originally collected.
Any thoughts on how you would treat this data?
Hi Andrew,
I would describe that kind of variable as a rate, and technically, you could end up with a rate of 1.47 prescriptions per 100 visits, even if you can’t have 1.47 prescriptions on one visit.
It’s best if you know both the actual count in the numerator of that rate and the count in the denominator. Here are a few articles on this:
https://www.theanalysisfactor.com/including-an-exposure-variable-in-count-models/
https://www.theanalysisfactor.com/incidence-rate-ratios-in-two-way-table/
https://www.theanalysisfactor.com/when-you-cannot-run-analysis-troubleshooting/
Hi. I need to do my SPSS output for my questionnaire. It was regarding Tinder to measure users satisfaction. However I need to identify the data variables in order to input it into SPSS. I did not ask for participants age nor gender as this wasn’t something I was interested in. What could be the other data variables for SPSS columns?
Hi Aurora, it entirely depends on the data you collected in your questionnaire.
Thank you soo much. This really helped. I love that is full of details. Good job
Hello,
My research title is : The effectiveness of alcohol-based hand sanitizers and educational aids on prevention of infectious diseases among children at day care centers.
What kind of data measurement level are my independent variables: hand sanitizers and educational aids?
Hi. May i ask some question? If the variable is about BMI. The choices given are underweight, normal, and overweight. What is the level of measurement will be used in that variable? I am confused if it is either nominal or ordinal.
Advance Thank you for your response.
Hey!
I’m not sure if I should define my variables!!!
I’m trying to figure out the year of death/date of death.
If I don’t do one of those I want to do decade of death but I don’t know how to define that either.
This is looking at the cause of death and season of the year
You haven’t covered one big area, which is stuff that looks continuous or ratio but probably isn’t. Is it meaningful to report that the mean house number on a street is 340.3? or that the average telephone number for a suburb is 1-340-32-45.82? In medicine, a good example is the Glasgow Coma Score (GCS) which is an ordinal scale from 3 to 15. Is it valid or meaningful to report a mean GCS of 12.3? Or how about cancer staging, which is usually reported as 1, 2 or 3: Is meaningful to report a mean cancer stage of 1.7 and to perform a t-test to compare groups? This frequently happens in the literature and in my opinion, it represents an abuse of statistics.
Hi I am a doctoral stident. I am not sure which test to use for correlation. I had planned on Spearman for ordinal data. I have been advised to use Kendall tau by one statistics professor and another suggested a factorial ANOVA. I am doing a descriptive correlation study. The variables that are ordinal are generation (3 groups) and what would be the DV , information literacy self- efficacy (ILSE) score that can be used as total score converted to 3 levels of High, mod, and low (ordinal) for RQ#1. For RQ 2 I use ordinal data for 3 gen, and 5 levels of education. The total scores for ILSE are nterval data. RQ 2 looks at what is the relationship between and among the 3 variables. Not sure if I need to run these as separate correlation s with a non parametric test or if I can use another statistic ?
There seems to be some confusion over variable being measured (age is ratio, period) and the way in which it is measured (always a discrete variable, so the measurement by ranges of ages is ordinal, but age is ratio).
And then, there is this old gem.
Lord, F. M. (1953). On the Statistical Treatment of Football Numbers. American Psychologist, 8(12), 750-751.
http://dx.doi.org/10.1037/h0063675
What will be the level of measurement for date of birth (dd_mm_yyyy)
If you’re intending to operate with dates, like subtracting today’s date minus someone’s date of birth, it would be ratio. But since the date is actually a composite variable, you may at times need to work only with year, or only with month, or even only with day. In my opinion, each one of these is an interval variable, as there is no 0 for any one of them. Furthermore, sometimes date is only an identifying tag over the time dimension and you may treat it as an ordinal variable!
hi Karen, great article. Am trying to figure out what my variables are for a correlational study. Emotional support and Reoffense rates are my variables. Trying to determine the negative relationship between the two, i believe emotional support will decrease the rate of recidivism. Would either of my variables be interval or ratio?
Hi, identifying levels of measurement is something I am still learning and trying to perfect right now. I wanted to confirm if my guesses were correct.
If i was measuring duration of wound healing (by days), would this be a ratio variable?
And would vitamin D supplementation ( one group gets Vit D 1000 units while another group gets a placebo) be a ratio variable ? I was considering nominal as well but I am not entirely sure.
is drug dosage a ration or interval measure?
thanks for your response in advance
Hi Kemi,
As I mentioned in the article, it depends on more than just the variable. In your design there may be only two drug dosages or there may be an infinite number.
In a mathematical sense, it is a ratio. However, for many medical purposes, it is more useful to treat it as ordinal.
Here’s an example: You can give a dose of 0 mg perindopril (a drug to treat hypertension), or 4 mg or 8 mg. You could (in a laboratory) measure out 65 mg of perindopril.
Tablets are not usually split, so you cannot give a patient 5mg of drug. If your response variable is blood pressure, then the output of your study is probably a graph with doses in the horizontal scale and blood pressure change from baseline in the vertical scale. Because you will only have doses of 0 mg (control subjects who don’t get any perindopril), 2 mg, 4 mg and 8 mg in your study, it makes sense to use a dot and whisker plot, box plot or bar chart to present this data for each dose group. In this instance, dose the perindopril dose is being treated as ordinal.
However, you may want to do dose-response modelling. A model requires that you use a continuous/interval variable as the input (e.g., Hill equation or related model) and when you find the “optimum” dose, the result that the model gives you may therefore be 5 mg or 6.82 mg or some other number which is impossible to dose: you will then have to make a recommendation to the clinician rounded to the closest feasible dose ()4 mg or 8 mg.
Dear Karen,
your article was very helpful. I am trying to figure out the levels of measurement for some variables I am using. First I have militarized interstate disputes ( I count how many there are during a year-I have determined this to be ratio), second GDP and military spending (again I think ratio), the one I can’t figure out is my independent variable time (years) years and Militarized interstate disputes will be analyzed together. I would be very thankful for your help.
Thank you
Verena
Hi Verena,
Years is very similar to the variable I used in the article: Age. Technically it’s ratio, but it all depends on how detailed the data was collected and how it’s going to be used.
Thanks for Your article! I am a beginner and I am trying to make a little analysis where dependent variable is monthly wage. In the data set it is measured in intervals (up to 370eur, 371-450, 451-700, 701-1400, 1401 and more). These are quite huge intervals and I am not sure how to approach them. Would You have any suggestion?
Hi Laura,
The fact that they’re huge intervals won’t affect how you treat them. Those are definitely ordinal categories.
thanks for the insightfull article. I will share it with my new group graduates