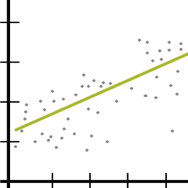
 You put a lot of work into preparing and cleaning your data. Running the model is the moment of excitement.
You look at your tables and interpret the results. But first you remember that one or more variables had a few outliers. Did these outliers impact your results? (more…)

In a previous post , Using the Same Sample for Different Models in Stata, we examined how to use the same sample when comparing regression models. Using different samples in our models could lead to erroneous conclusions when interpreting results.
But excluding observations can also result in inaccurate results.
The coefficient for the variable “frequent religious attendance” was negative 58 in model 3 (more…)
In a previous post we explored bounded variables and the difference between truncated and censored. Can we ignore the fact that a variable is bounded and just run our analysis as if the data wasn’t bounded? (more…)
Proportion and percentage data are tricky to analyze.
Much like count data, they look like they should work in a linear model.
They’re numeric. They’re often continuous.
And sometimes they do work. Some proportion data do look normally distributed so estimates and p-values are reasonable.
But more often they don’t. So estimates and p-values are a mess. Luckily, there are other options. (more…)
By Manolo Romero Escobar
If you already know the principles of general linear modeling (GLM) you are on the right path to understand Structural Equation Modeling (SEM).
As you could see from my previous post, SEM offers the flexibility of adding paths between predictors in a way that would take you several GLM models and still leave you with unanswered questions.
It also helps you use latent variables (as you will see in future posts).
GLM is just one of the pieces of the puzzle to fit SEM to your data. You also need to have an understanding of:
(more…)
Like the chicken and the egg, there’s a question about which comes first: run a model or check assumptions? Unlike the chicken’s, the model’s question has an easy answer.
There are two types of model assumptions in a statistical model. Some are distributional assumptions about the errors. Examples include independence, normality, and constant variance in a linear model.
 Others are about the form of the model. They include linearity and (more…)
 You put a lot of work into preparing and cleaning your data. Running the model is the moment of excitement.

