count regression models resources
Like continuous variables, count variable are numerical. So it seems you should be able to apply methods for continuous data to count data. After all, a mean makes sense for both.
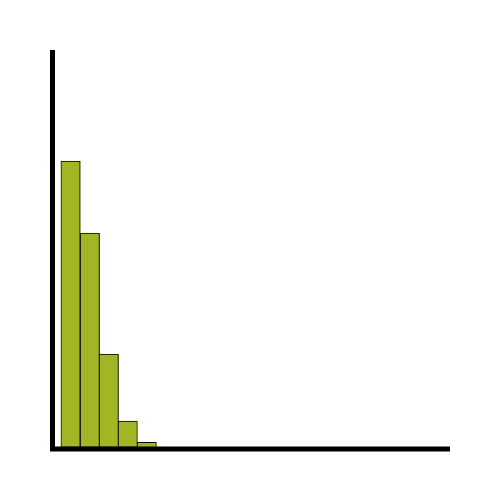
But count data aren’t continuous. They’re discrete. They follow different distributions than continuous variables, and these differences can actually make the results quite different.
It’s important to apply models that assume count data. Get more info on these kinds of models here.
online workshops
Analyzing Count Data: Poisson, Negative Binomial, and Other Essential Models

Once you learn the ins and outs of linear models, it can seem that you’re ready to tackle any dependent variable. But not all numerical dependent variables are created equal! Some are discrete, not continuous. If you apply linear regression, which is designed for continuous dependent variables, to discrete dependent variables, you’re going to run into some BIG issues. learn more
the craft of statistical analysis free webinars
Poisson and Negative Binomial Regression for Count Data
Ever discover that your data are not normally distributed, no matter what transformation you try? It may be that they follow another distribution altogether. Although they are numerical, discrete count data often follow a Poisson or Negative Binomial distribution, not a normal one. learn more
statistically speaking member trainings
Zero Inflated Models
A common situation with count outcome variables is there are a lot of zero values. The Poisson distribution used for modeling count variables takes into account that zeros are often the most common value, but sometimes there are even more zeros than the Poisson distribution can account for. learn more
Making Sense of Statistical Distributions
Many who work with statistics are already functionally familiar with the normal distribution, and maybe even the binomial distribution. These common distributions are helpful in many applications, but what happens when they just don’t work? learn more
Generalized Linear Models
Generalized linear models are designed to work with outcomes that aren’t normally distributed, but have other recognizable characteristics, such as being counts, proportions, or belonging to categories. They are often exactly what you need when you just can’t get a normal distribution to fit. learn more
Types of Regression Models and When to Use Them
Linear, Logistic, Tobit, Cox, Poisson, Zero Inflated… The list of regression models goes on and on before you even get to things like ANCOVA or Linear Mixed Models. learn more
articles at the analysis factor
Poisson and Negative Binomial Regression
Poisson Regression Analysis for Count Data
There are many dependent variables that no matter how many transformations you try, you cannot get to be normally distributed. The most common culprits are count variables–the variable that measures the count or rate of some event in a sample. learn more
Differences Between the Normal and Poisson Distributions

The normal distribution is so ubiquitous in statistics that those of us who use a lot of statistics tend to forget it’s not always so common in actual data. And since the normal distribution is continuous, many people describe all numerical variables as continuous. I get it: I’m guilty of using those terms interchangeably, too, but they’re not exactly the same. learn more
Analyzing Zero-Truncated Count Data: Length of Stay in the ICU for Flu Victims
Let’s imagine you have been asked to determine the factors that will help a hospital determine the length of stay in the intensive care unit once a patient is admitted. The hospital tells you that once the patient is admitted to the ICU, he or she has a day count of one. As soon as they spend 24 hours plus 1 minute, they have stayed an additional day. Clearly this is count data. There are no fractions, only whole numbers. learn more
Interpreting Regression Coefficients in Models other than Ordinary Linear Regression
Someone who registered for my Interpreting (Even Tricky) Regression Models workshop asked if the content applies to logistic regression as well. The short answer: Yes. The detailed explanation of why this is true and the one caveat: One of the greatest things about regression models is that they all have the same set up. learn more
Understanding Incidence Rate Ratios through the Eyes of a Two-Way Table
The coefficients of count model regression tables are shown in either logged form or as incidence rate ratios. Trying to explain the coefficients in logged form can be a difficult process. Incidence rate ratios are much easier to explain. You probably didn’t realize you’ve seen incidence rate ratios before, expressed differently. learn more
Two-Way Tables and Count Models: Expected and Predicted Counts
Previously, we discussed how incidence rate ratios calculated in a Poisson regression can be determined from a two-way table of categorical variables. Statistical software can also calculate the expected (aka predicted) count for each group. learn more
The Exposure Variable in Poisson Regression Models
Poisson Regression Models and its extensions (Zero-Inflated Poisson, Negative Binomial Regression, etc.) are used to model counts and rates. Most count variables follow one of these distributions in the Poisson family. Poisson regression models allow researchers to examine the relationship between predictors and count outcome variables. learn more
Zero-Inflated Poisson Models for Count Outcomes
There are quite a few types of outcome variables that will never meet ordinary linear model’s assumption of normally distributed residuals. A non-normal outcome variable can have normally distribued residuals, but it does need to be continuous, unbounded, and measured on an interval or ratio scale. learn more
When Can Count Data be Considered Continuous?
Recently I did a webinar on Poisson and negative binomial models for count data. With a few hundred participants, we ran out of time to get through all the questions, so I’m answering some of them here on the blog. This set of questions are all related to when it’s appropriate to treat count data as continuous and run the more familiar and simpler linear model. learn more
Count Models: Understanding the Log Link Function
In linear regression, we assume that probability distribution is normal. But there are a lot of outcome variables for which a normal distribution doesn’t fit. Generalized linear models allow a few other distributions, including Poisson, binomial, and Gamma (among others). learn more
Issues with Truncated Data
Previously, we explored bounded variables and the difference between truncated and censored. Can we ignore the fact that a variable is bounded and just run our analysis as if the data wasn’t bounded? Count data, which consists of non-negative integers, are naturally bounded – you can’t have negative counts. learn more
Overdispersion in Count Models: Fit the Model to the Data, Don’t Fit the Data to the Model
If you have count data you use a Poisson model for the analysis, right? The key criterion for using a Poisson model is after accounting for the effect of predictors, the mean must equal the variance. If the mean doesn’t equal the variance then all we have to do is transform the data or tweak the model, correct? learn more
Count Models in the Context of Generalized Linear Models
Confusing Statistical Term #7: GLM
Like some of the other terms in our list, GLM has two different meanings. It’s a little different than the others, though, because it’s an abbreviation for two different terms: General Linear Model and Generalized Linear Model. It’s extra confusing because their names are so similar on top of having the same abbreviation. learn more
Generalized Linear Models in R, Part 6: Poisson Regression for Count Variables
Earlier in the series, I demonstrated a logistic regression model with binomial errors on binary data in R’s glm() function. But one of wonderful things about glm() is that it is so flexible. It can run so much more than logistic regression models. The flexibility, of course, also means that you have to tell it exactly which model you want to run, and how. In fact, we can use generalized linear models to model count data as well. learn more
Generalized Linear Models in R, Part 7: Checking for Overdispersion in Count Regression
Last time, we fitted a generalized linear model to count data using a Poisson error structure. We found, however, that there was over-dispersion in the data – the variance was larger than the mean in our dependent variable. Over-dispersion is a problem if the conditional variance (residual variance) is larger than the conditional mean. learn more
Five Extensions of the General Linear Model
Generalized linear models, linear mixed models, generalized linear mixed models, marginal models, GEE models. You’ve probably heard of more than one of them and you’ve probably also heard that each one is an extension of our old friend, the general linear model. learn more
How to Combine Complicated Models with Tricky Effects
Need to dummy code in a Cox regression model? Interpret interactions in a logistic regression? Add a quadratic term to a multilevel model? This is where statistical analysis starts to feel really hard. You’re combining two difficult issues into one. learn more
When Linear Models Don’t Fit Your Data, Now What?
When your dependent variable is not continuous, unbounded, and measured on an interval or ratio scale, linear models don’t fit. The data just will not meet the assumptions of linear models. But there’s good news: other models exist for many types of dependent variables. learn more
6 Types of Dependent Variables that will Never Meet the Linear Model Normality Assumption
The assumptions of normality and constant variance in a linear model (both OLS regression and ANOVA) are quite robust to departures. That means that even if the assumptions aren’t met perfectly, the resulting p-values will still be reasonable estimates. But you need to check the assumptions anyway, because some departures are so far that the p-value become inaccurate. learn more
Interpreting Regression Coefficients in Models other than Ordinary Linear Regression
Someone who registered for my Interpreting (Even Tricky) Regression Models workshop asked if the content applies to logistic regression as well. The short answer: Yes. The detailed explanation of why this is true and the one caveat: One of the greatest things about regression models is that they all have the same set up. learn more