 A normal probability plot is extremely useful for checking normality assumptions. It’s more precise than a histogram, which can’t pick up subtle deviations. And yet it doesn’t suffer from too much power from large samples with tiny departures from normality or too little power from small samples with large departures from normality, as do tests like Shaprio-Wilkes.
The biggest problem with a normal probability plot is that it’s hard to read, especially if you’re not used to them. So let’s take a moment and walk through exactly how they work and what they tell you.
There are two versions of normal probability plot: Q-Q and P-P. I’ll start with the Q-Q. (more…)
 Level is a statistical term that is confusing because it has multiple meanings in different contexts (much like alpha and beta).
There are three different uses of the term Level in statistics that mean completely different things. What makes this especially confusing is that all three of them can be used in the exact same analysis context.
I’ll show you an example of that at the end.
So when you’re talking to someone who is learning statistics or who happens to be thinking of that term in a different context, this gets especially confusing.
Levels of Measurement
 The most widespread of these is levels of measurement. Stanley Stevens came up with this taxonomy of assigning numerals to variables in the 1940s. You probably learned about them in your Intro Stats course: the nominal, ordinal, interval, and ratio levels.
Levels of measurement is really a measurement concept, not a statistical one. It refers to how much and the type of information a variable contains. Does it indicate an unordered category, a quantity with a zero point, etc?
So if you hear the following phrases, you’ll know that we’re using the term level to mean measurement level:
- nominal level
- ordinal level
- interval level
- ratio level
It is important in statistics because it has a big impact on which statistics are appropriate for any given variable. For example, you would not do the same test of association between two variables measured at a nominal level as you would between two variables measured at an interval level.
That said, levels of measurement aren’t the only information you need about a variable’s measurement. There is, of course, a lot more nuance.
Levels of a Factor
Another common usage of the term level is within experimental design and analysis. And this is for the levels of a factor. Although Factor itself has multiple meanings in statistics, here we are talking about a categorical independent variable.
In experimental design, the predictor variables (also often called Independent Variables) are generally categorical and nominal. They represent different experimental conditions, like treatment and control conditions.
Each of these categorical conditions is called a level.
Here are a few examples:
- In an agricultural study, a fertilizer treatment variable has three levels: Organic fertilizer (composted manure); High concentration of chemical fertilizer; low concentration of chemical fertilizer.So you’ll hear things like: “we compared the high concentration level to the control level.”
- In a medical study, a drug treatment has three levels: Placebo; standard drug for this disease; new drug for this disease.
- In a linguistics study, a word frequency variable has two levels: high frequency words; low frequency words.
Now, you may have noticed that some of these examples actually indicate a high or low level of something. I’m pretty sure that’s where this word usage came from. But you’ll see it used for all sorts of variables, even when they’re not high or low.
Although this use of level is very widespread, I try to avoid it personally. Instead I use the word “value” or “category” both of which are accurate, but without other meanings. That said, “level” is pretty entrenched in this context.
Level in Multilevel Models or Multilevel Data
A completely different use of the term is in the context of multilevel models. Multilevel models is a 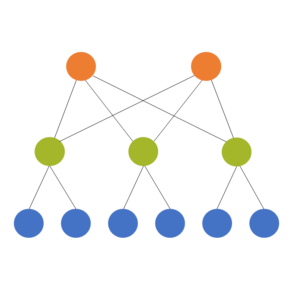 term for some mixed models. (The terms multilevel models and mixed models are often used interchangably, though mixed model is a bit more flexible).
Multilevel models are used for multilevel (also called hierarchical or nested) data, which is where they get their name. The idea is that the units we’ve sampled from the population aren’t independent of each other. They’re clustered in such a way that their responses will be more similar to each other within a cluster.
The models themselves have two or more sources of random variation. A two level model has two sources of random variation and can have predictors at each level.
A common example is a model from a design where the response variable of interest is measured on students. It’s hard though, to sample students directly or to randomly assign them to treatments, since there is a natural clustering of students within schools.
So the resource-efficient way to do this research is to sample students within schools.
Predictors can be measured at the student level (eg. gender, SES, age) or the school level (enrollment, % who go on to college). The dependent variable has variation from student to student (level 1) and from school to school (level 2).
We always count these levels from the bottom up. So if we have students clustered within classroom and classroom clustered within school and school clustered within district, we have:
- Level 1: Students
- Level 2: Classroom
- Level 3: School
- Level 4: District
So this use of the term level describes the design of the study, not the measurement of the variables or the categories of the factors.
Putting them together
So this is the truly unfortunate part. There are situations where all three definitions of level are relevant within the same statistical analysis context.
I find this unfortunate because I think using the same word to mean completely different things just confuses people. But here it is:
Picture that study in which students are clustered within school (a two-level design). Each school is assigned to use one of three math curricula (the independent variable, which happens to be categorical).
So, the variable “math curriculum” is a factor with three levels (ie, three categories).
Because those three categories of “math curriculum” are unordered, “math curriculum” has a nominal level of measurement.
And since “math curriculum” is assigned to each school, it is considered a level 2 variable in the two-level model.
See the rest of the Confusing Statistical Terms series.
First published December 12, 2008
Last Updated January 21, 2025
No matter what statistical model you’re running, you need to take the same steps. The order and the specifics of 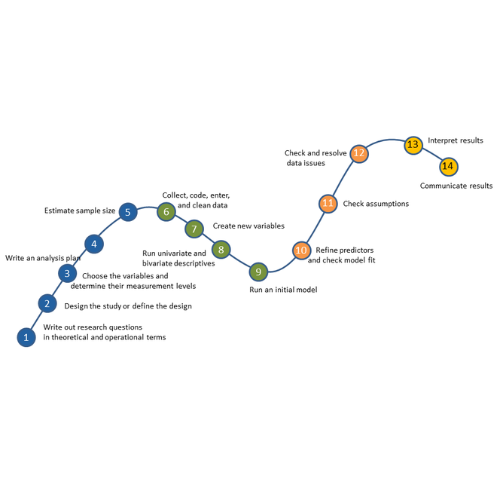 how you do each step will differ depending on the data and the type of model you use.
These steps are in 4 phases. Most people think of only the third as modeling. But the phases before this one are fundamental to making the modeling go well. It will be much, much easier, more accurate, and more efficient if you don’t skip them.
And there is no point in running the model if you skip the last phase. That’s where you communicate the results.
I’ve found that if I think of them all as part of the analysis, the modeling process is faster, easier, and makes more sense.
Phase 1: Define and Design
In the first five steps of running the model, the object is clarity. You want to make everything as clear as possible to yourself. The clearer things are at this point, the smoother everything will be. (more…)
There are many designs that could be considered Repeated Measures design, and they all have one key feature: you measure the outcome variable for each subject on several occasions, treatments, or locations.
Understanding this design is important for avoiding analysis mistakes. For example, you can’t treat multiple observations on the same subject as independent observations.
Example
Suppose that you recruit 10 subjects (more…)
I recently received a great question in a comment about whether the assumptions of normality, constant variance, and independence in linear models are about the errors, εi, or the response variable, Yi.
The asker had a situation where Y, the response, was not normally distributed, but the residuals were.
Quick Answer: It’s just the errors.
In fact, if you look at any (good) statistics textbook on linear models, you’ll see below the model, stating the assumptions: (more…)
One of those tricky, but necessary, concepts in statistics is the difference between crossed and nested factors.
As a reminder, a factor is any categorical independent variable. In experiments, or any randomized designs, these factors are often manipulated. Experimental manipulations (like Treatment vs. Control) are factors.
Observational categorical predictors, such as gender, time point, poverty status, etc., are also factors. Whether the factor is observational or manipulated won’t affect the analysis, but it will affect the conclusions you draw from the results.
(more…)