Every time you analyze data, you start with a research question and end with communicating an answer. But in between those start and end points are twelve other steps. I call this the Data Analysis Pathway. It’s a framework I put together years ago, inspired by a client who kept getting stuck in Weed #1. But I’ve honed it over the years of assisting thousands of researchers with their analysis.
OptinMon 10 - 14 Steps
Four Weeds of Data Analysis That are Easy to Get Lost In
January 18th, 2021 by Karen Grace-Martin
The Difference Between Model Assumptions, Inference Assumptions, and Data Issues
December 23rd, 2020 by Karen Grace-Martin
Have you ever compared the list of model assumptions for linear regression across two sources? Whether they’re textbooks, lecture  notes, or web pages, chances are the assumptions don’t quite line up.
Why? Sometimes the authors use different terminology. So it just looks different.
And sometimes they’re including not only model assumptions, but inference assumptions and data issues. All are important, but understanding the role of each can help you understand what applies in your situation.
Model Assumptions
The actual model assumptions are about the specification and performance of the model for estimating the parameters well.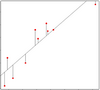
1. The errors are independent of each other
2. The errors are normally distributed
3. The errors have a mean of 0 at all values of X
4. The errors have constant variance
5. All X are fixed and are measured without error
6. The model is linear in the parameters
7. The predictors and response are specified correctly
8. There is a single source of unmeasured random variance
Not all of these are always explicitly stated. And you can’t check them all. How do you know you’ve included all the “correct” predictors?
But don’t skip the step of checking what you can. And for those you can’t, take the time to think about how likely they are in your study. Report that you’re making those assumptions.
Assumptions about Inference
Sometimes the assumption is not really about the model, but about the types of conclusions or interpretations you can make about the results.
These assumptions allow the model to be useful in answering specific research questions based on the research design. They’re not about how well the model estimates parameters.
Is this important? Heck, yes. Studies are designed to answer specific research questions. They can only do that if these inferential assumptions hold.
But if they don’t, it doesn’t mean the model estimates are wrong, biased, or inefficient. It simply means you have to be careful about the conclusions you draw from your results. Sometimes this is a huge problem.
But these assumptions don’t apply if they’re for designs you’re not using or inferences you’re not trying to make. This is a situation when reading a statistics book that is written for a different field of application can really be confusing. They focus on the types of designs and inferences that are common in that field.
It’s hard to list out these assumptions because they depend on the types of designs that are possible given ethics and logistics and the types of research questions. But here are a few examples:
1. ANCOVA assumes the covariate and the IV are uncorrelated and do not interact. (Important only in experiments trying to make causal inferences).
2. The predictors in a regression model are endogenous. (Important for conclusions about the relationship between Xs and Y where Xs are observed variables).
3. The sample is representative of the population of interest. (This one is always important!)
Data Issues that are Often Mistaken for Assumptions
And sometimes the list of assumptions includes data issues. Data issues are a little different.
They’re important. They affect how you interpret the results. And they impact how well the model performs.
But they’re still different. When a model assumption fails, you can sometimes solve it by using a different type of model. Data issues generally stay around.
That’s a big difference in practice.
Here are a few examples of common data issues:
1. Small Samples
2. Outliers
3. Multicollinearity
4. Missing Data
5. Truncation and Censoring
6. Excess Zeros
So check for these data issues, deal with them if the solution doesn’t create more problems than you solved, and be careful with the inferences you draw when you can’t.
Go to the next article or see the full series on Easy-to-Confuse Statistical Concepts
Chi-Square Test of Independence Rule of Thumb: n > 5
July 15th, 2020 by Audrey Schnell
Ever hear this rule of thumb: “The Chi-Square test is invalid if we have fewer than 5 observations in a cell”.
I frequently hear this mis-understood and incorrect “rule.”
We all want rules of thumb even though we know they can be wrong, misleading, or misinterpreted.
Rules of Thumb are like Urban Myths or like a bad game of ‘Telephone’. The actual message gets totally distorted over time.
Three Rules of Statistical Analysis from Your Statistics Class to Unlearn
April 28th, 2020 by Karen Grace-Martin
There are important ‘rules’ of statistical analysis. Like
- Always run descriptive statistics and graphs before running tests
- Use the simplest test that answers the research question and meets assumptions
- Always check assumptions.
But there are others you may have learned in statistics classes that don’t serve you or your analysis well once you’re working with real data.
When you are taking statistics classes, there is a lot going on. You’re learning concepts, vocabulary, and some really crazy notation. And probably a software package on top of that.
In other words, you’re learning a lot of hard stuff all at once.
Good statistics professors and textbook authors know that learning comes in stages. Trying to teach the nuances of good applied statistical analysis to students who are struggling to understand basic concepts results in no learning at all.
And yet students need to practice what they’re learning so it sticks. So they teach you simple rules of application. Those simple rules work just fine for students in a stats class working on sparkling clean textbook data.
But they are over-simplified for you, the data analyst, working with real, messy data.
Here are three rules of data analysis practice that you may have learned in classes that you need to unlearn. They are not always wrong. They simply don’t allow for the nuance involved in real statistical analysis.
The Rules of Statistical Analysis to Unlearn:
1. To check statistical assumptions, run a test. Decide whether the assumption is met by the significance of that test.
Every statistical test and model has assumptions. They’re very important. And they’re not always easy to verify.
For many assumptions, there are tests whose sole job is to test whether the assumption of another test is being met. Examples include the Levene’s test for constant variance and Kolmogorov-Smirnov test, often used for normality. These tests are tools to help you decide if your model assumptions are being met.
But they’re not definitive.
When you’re checking assumptions, there are a lot of contextual issues you need to consider: the sample size, the robustness of the test you’re running, the consequences of not meeting assumptions, and more.
What to do instead:
Use these test results as one of many pieces of information that you’ll use together to decide whether an assumption is violated.
2. Delete outliers that are 3 or more standard deviations from the mean.
This is an egregious one. Really. It’s bad.![]()
Yes, it makes the data look pretty. Yes, there are some situations in which it’s appropriate to delete outliers (like when you have evidence that it’s an error). And yes, outliers can wreak havoc on your parameter estimates.
But don’t make it a habit. Don’t follow a rule blindly.
Deleting outliers because they’re outliers (or using techniques like Winsorizing) is a great way to introduce bias into your results or to miss the most interesting part of your data set.
What to do instead:
When you find an outlier, investigate it. Try to figure out if it’s an error. See if you can figure out where it came from.
3. Check Normality of Dependent Variables before running a linear model
 In a t-test, yes, there is an assumption that Y, the dependent variable, is normally distributed within each group. In other words, given the group as defined by X, Y follows a normal distribution.
ANOVA has a similar assumption: given the group as defined by X, Y follows a normal distribution.
In linear regression (and ANCOVA), where we have continuous variables, this same assumption holds. But it’s a little more nuanced since X is not necessarily categorical. At any specific value of X, Y has a normal distribution. (And yes, this is equivalent to saying the errors have a normal distribution).
But here’s the thing: the distribution of Y as a whole doesn’t have to be normal.
In fact, if X has a big effect, the distribution of Y, across all values of X, will often be skewed or bimodal or just a big old mess. This happens even if the distribution of Y, at each value of X, is perfectly normal.
What to do instead:
Because normality depends on which Xs are in a model, check assumptions after you’ve chosen predictors.
Conclusion:
The best rule in statistical analysis: always stop and think about your particular data analysis situation.
If you don’t understand or don’t have the experience to evaluate your situation, discuss it with someone who does. Investigate it. This is how you’ll learn.
Should Confidence Intervals or Tests of Significance be Used?
December 20th, 2019 by Christos Giannoulis
What is a Confidence Interval?
Any sample-based findings used to generalize a population are subject to sampling error. In other words, sample statistics won’t exactly match the population parameters they estimate.
The Wisdom of Asking Silly Statistics Questions
November 12th, 2019 by Karen Grace-Martin
I’ve written about this before–there is just something about statistics that makes people feel…well, not so smart.

This makes people v-e-r-y reluctant to ask questions.
This fact really struck me years and years ago. Hit me hard.