Covariate is a tricky term in a different way than hierarchical or beta, which have completely different meanings in different contexts.
Covariate really has only one meaning, but it gets tricky because the meaning has different implications in different situations, and people use it in slightly different ways. And these different ways of using the term have BIG implications for what your model means.
The most precise definition is its use in Analysis of Covariance, a type of General Linear Model in which the independent variables of interest are categorical, but you also need to adjust for the effect of an observed, continuous variable–the covariate.
In this context, the covariate is always continuous, never the key independent variable, (more…)
This one is relatively simple. Very similar names for two totally different concepts.
Hierarchical Models (aka Hierarchical Linear Models or HLM) are a type of linear regression models in which the observations fall into hierarchical, or completely nested levels.
Hierarchical Models are a type of Multilevel Models.
So what is a hierarchical data structure, which requires a hierarchical model?
The classic example is data from children nested within schools. The dependent variable could be something like math scores, and the predictors a whole host of things measured about the child and the school.
Child-level predictors could be things like GPA, grade, and gender. School-level predictors could be things like: total enrollment, private vs. public, mean SES.
Because multiple children are measured from the same school, their measurements are not independent. Hierarchical modeling takes that into account.
Hierarchical regression is a model-building technique in any regression model. It is the practice of building successive linear regression models, each adding more predictors.
For example, one common practice is to start by adding only demographic control variables to the model. In the next model, you can add predictors of interest, to see if they predict the DV above and beyond the effect of the controls.
You’re actually building separate but related models in each step. But SPSS has a nice function where it will compare the models, and actually test if successive models fit better than previous ones.
So hierarchical regression is really a series of regular old OLS regression models–nothing fancy, really.
Confusing Statistical Terms #1: Independent Variable
Confusing Statistical Terms #2: Alpha and Beta
Confusing Statistical Terms #3: Levels
Oh so many years ago I had my first insight into just how ridiculously confusing all the statistical terminology can be for novices.
I was TAing a two-semester applied statistics class for graduate students in biology. It started with basic hypothesis testing and went on through to multiple regression.
It was a cross-listed class, meaning there were a handful of courageous (or masochistic) undergrads in the class, and they were having trouble keeping (more…)
One of the biggest challenges in learning statistics and data analysis is learning the lingo. It doesn’t help that half of the notation is in Greek (literally).
The terminology in statistics is particularly confusing because often the same word or symbol is used to mean completely different concepts.
I know it feels that way, but it really isn’t a master plot by statisticians to keep researchers feeling ignorant.
Really.
It’s just that a lot of the methods in statistics were created by statisticians working in different fields–economics, psychology, medicine, and yes, straight statistics. Certain fields often have specific types of data that come up a lot and that require specific statistical methodologies to analyze.
Economics needs time series, psychology needs factor analysis. Et cetera, et cetera.
But separate fields developing statistics in isolation has some ugly effects.
Sometimes different fields develop the same technique, but use different names or notation.
Other times different fields use the same name or notation on different techniques they developed.
And of course, there are those terms with slightly different names, often used in similar contexts, but with different meanings. These are never used interchangeably, but they’re easy to confuse if you don’t use this stuff every day.
And sometimes, there are different terms for subtly different concepts, but people use them interchangeably. (I am guilty of this myself). It’s not a big deal if you understand those subtle differences. But if you don’t, it’s a mess.
And it’s not just fields–it’s software, too.
SPSS uses different names for the exact same thing in different procedures. In GLM, a continuous independent variable is called a Covariate. In Regression, it’s called an Independent Variable.
Likewise, SAS has a Repeated statement in its GLM, Genmod, and Mixed procedures. They all get at the same concept there (repeated measures), but they deal with it in drastically different ways.
So once the fields come together and realize they’re all doing the same thing, people in different fields or using different software procedures, are already used to using their terminology. So we’re stuck with different versions of the same word or method.
So anyway, I am beginning a series of blog posts to help clear this up. Hopefully it will be a good reference you can come back to when you get stuck.
We’ve expanded on this list with a member training, if you’re interested.
If you have good examples, please post them in the comments. I’ll do my best to clear things up.
Statistical models, such as general linear models (linear regression, ANOVA, MANOVA), linear mixed models, and generalized linear models (logistic, Poisson, regression, etc.) all have the same general form.
On the left side of the equation is one or more response variables, Y. On the right hand side is one or more predictor variables, X, and their coefficients, B. The variables on the right hand side can have many forms and are called by many names.
There are subtle distinctions in the meanings of these names. Unfortunately, though, there are two practices that make them more confusing than they need to be.
First, they are often used interchangeably. So someone may use “predictor variable” and “independent variable” interchangably and another person may not. So the listener may be reading into the subtle distinctions that the speaker may not be implying.
Second, the same terms are used differently in different fields or research situations. So if you are an epidemiologist who does research on mostly observed variables, you probably have been trained with slightly different meanings to some of these terms than if you’re a psychologist who does experimental research.
Even worse, statistical software packages use different names for similar concepts, even among their own procedures. This quest for accuracy often renders confusion. (It’s hard enough without switching the words!).
Here are some common terms that all refer to a variable in a model that is proposed to affect or predict another variable.
I’ll give you the different definitions and implications, but it’s very likely that I’m missing some. If you see a term that means something different than you understand it, please add it to the comments. And please tell us which field you primarily work in.
Predictor Variable, Predictor
This is the most generic of the terms. There are no implications for being manipulated, observed, categorical, or numerical. It does not imply causality.
A predictor variable is simply used for explaining or predicting the value of the response variable. Used predominantly in regression.
Independent Variable
I’ve seen Independent Variable (IV) used different ways.
1. It implies causality: the independent variable affects the dependent variable. This usage is predominant in ANOVA models where the Independent Variable is manipulated by the experimenter. If it is manipulated, it’s generally categorical and subjects are randomly assigned to conditions.
2. It does not imply causality, but it is a key predictor variable for answering the research question. In other words, it is in the model because the researcher is interested in understanding its relationship with the dependent variable. In other words, it’s not a control variable.
3. It does not imply causality or the importance of the variable to the research question. But it is uncorrelated (independent) of all other predictors.
Honestly, I only recently saw someone define the term Independent Variable this way. Predictor Variables cannot be independent variables if they are at all correlated. It surprised me, but it’s good to know that some people mean this when they use the term.
Explanatory Variable
A predictor variable in a model where the main point is not to predict the response variable, but to explain a relationship between X and Y.
Control Variable
A predictor variable that could be related to or affecting the dependent variable, but not really of interest to the research question.
Covariate
Generally a continuous predictor variable. Used in both ANCOVA (analysis of covariance) and regression. Some people use this to refer to all predictor variables in regression, but it really means continuous predictors. Adding a covariate to ANOVA (analysis of variance) turns it into ANCOVA (analysis of covariance).
Sometimes covariate implies that the variable is a control variable (as opposed to an independent variable), but not always.
And sometimes people use covariate to mean control variable, either numerical or categorical.
This one is so confusing it got it’s own Confusing Statistical Terms article.
Confounding Variable, Confounder
These terms are used differently in different fields. In experimental design, it’s used to mean a variable whose effect cannot be distinguished from the effect of an independent variable.
In observational fields, it’s used to mean one of two situations. The first is a variable that is so correlated with an independent variable that it’s difficult to separate out their effects on the response variable. The second is a variable that causes the independent variable’s effect on the response.
The distinction in those interpretations are slight but important.
Exposure Variable
This is a term for independent variable in some fields, particularly epidemiology. It’s the key predictor variable.
Risk Factor
Another epidemiology term for a predictor variable. Unlike the term “Factor” listed below, it does not imply a categorical variable.
Factor
A categorical predictor variable. It may or may not indicate a cause/effect relationship with the response variable (this depends on the study design, not the analysis).
Independent variables in ANOVA are almost always called factors. In regression, they are often referred to as indicator variables, categorical predictors, or dummy variables. They are all the same thing in this context.
Also, please note that Factor has completely other meanings in statistics, so it too got its own Confusing Statistical Terms article.
Feature
Used in Machine Learning and Predictive models, this is simply a predictor variable.
Grouping Variable
Same as a factor.
Fixed factor
A categorical predictor variable in which the specific values of the categories are intentional and important, often chosen by the experimenter. Examples include experimental treatments or demographic categories, such as sex and race.
If you’re not doing a mixed model (and you should know if you are), all your factors are fixed factors. For a more thorough explanation of fixed and random factors, see Specifying Fixed and Random Factors in Mixed or Multi-Level Models
Random factor
A categorical predictor variable in which the specific values of the categories were randomly assigned. Generally used in mixed modeling. Examples include subjects or random blocks.
For a more thorough explanation of fixed and random factors, see Specifying Fixed and Random Factors in Mixed or Multi-Level Models
Blocking variable
This term is generally used in experimental design, but I’ve also seen it in randomized controlled trials.
A blocking variable is a variable that indicates an experimental block: a cluster or experimental unit that restricts complete randomization and that often results in similar response values among members of the block.
Blocking variables can be either fixed or random factors. They are never continuous.
Dummy variable
A categorical variable that has been dummy coded. Dummy coding (also called indicator coding) is usually used in regression models, but not ANOVA. A dummy variable can have only two values: 0 and 1. When a categorical variable has more than two values, it is recoded into multiple dummy variables.
Indicator variable
Same as dummy variable.
The Take Away Message
Whenever you’re using technical terms in a report, an article, or a conversation, it’s always a good idea to define your terms. This is especially important in statistics, which is used in many, many fields, each of whom adds their own subtleties to the terminology.
Confusing Statistical Terms #1: The Many Names of Independent Variables
 Level is a statistical term that is confusing because it has multiple meanings in different contexts (much like alpha and beta).
There are three different uses of the term Level in statistics that mean completely different things. What makes this especially confusing is that all three of them can be used in the exact same analysis context.
I’ll show you an example of that at the end.
So when you’re talking to someone who is learning statistics or who happens to be thinking of that term in a different context, this gets especially confusing.
Levels of Measurement
 The most widespread of these is levels of measurement. Stanley Stevens came up with this taxonomy of assigning numerals to variables in the 1940s. You probably learned about them in your Intro Stats course: the nominal, ordinal, interval, and ratio levels.
Levels of measurement is really a measurement concept, not a statistical one. It refers to how much and the type of information a variable contains. Does it indicate an unordered category, a quantity with a zero point, etc?
So if you hear the following phrases, you’ll know that we’re using the term level to mean measurement level:
- nominal level
- ordinal level
- interval level
- ratio level
It is important in statistics because it has a big impact on which statistics are appropriate for any given variable. For example, you would not do the same test of association between two variables measured at a nominal level as you would between two variables measured at an interval level.
That said, levels of measurement aren’t the only information you need about a variable’s measurement. There is, of course, a lot more nuance.
Levels of a Factor
Another common usage of the term level is within experimental design and analysis. And this is for the levels of a factor. Although Factor itself has multiple meanings in statistics, here we are talking about a categorical independent variable.
In experimental design, the predictor variables (also often called Independent Variables) are generally categorical and nominal. They represent different experimental conditions, like treatment and control conditions.
Each of these categorical conditions is called a level.
Here are a few examples:
- In an agricultural study, a fertilizer treatment variable has three levels: Organic fertilizer (composted manure); High concentration of chemical fertilizer; low concentration of chemical fertilizer.So you’ll hear things like: “we compared the high concentration level to the control level.”
- In a medical study, a drug treatment has three levels: Placebo; standard drug for this disease; new drug for this disease.
- In a linguistics study, a word frequency variable has two levels: high frequency words; low frequency words.
Now, you may have noticed that some of these examples actually indicate a high or low level of something. I’m pretty sure that’s where this word usage came from. But you’ll see it used for all sorts of variables, even when they’re not high or low.
Although this use of level is very widespread, I try to avoid it personally. Instead I use the word “value” or “category” both of which are accurate, but without other meanings. That said, “level” is pretty entrenched in this context.
Level in Multilevel Models or Multilevel Data
A completely different use of the term is in the context of multilevel models. Multilevel models is a  term for some mixed models. (The terms multilevel models and mixed models are often used interchangably, though mixed model is a bit more flexible).
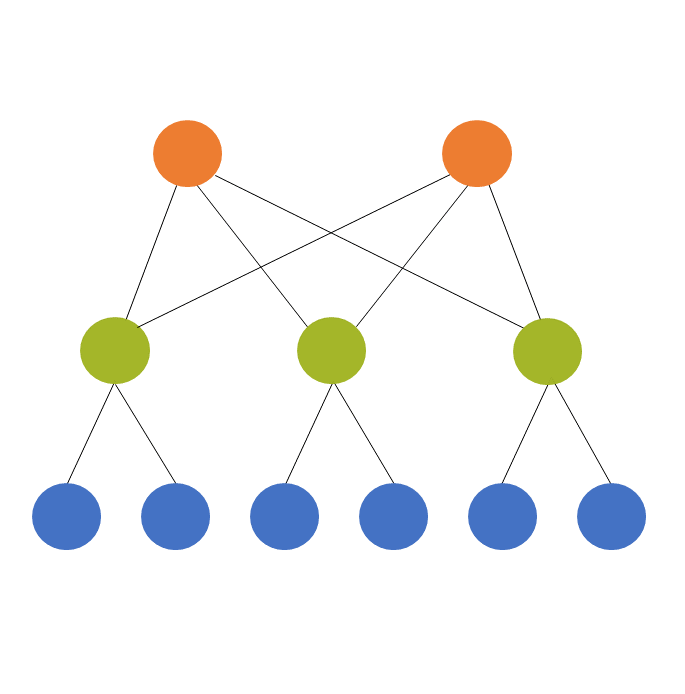
Multilevel models are used for multilevel (also called hierarchical or nested) data, which is where they get their name. The idea is that the units we’ve sampled from the population aren’t independent of each other. They’re clustered in such a way that their responses will be more similar to each other within a cluster.
The models themselves have two or more sources of random variation. A two level model has two sources of random variation and can have predictors at each level.
A common example is a model from a design where the response variable of interest is measured on students. It’s hard though, to sample students directly or to randomly assign them to treatments, since there is a natural clustering of students within schools.
So the resource-efficient way to do this research is to sample students within schools.
Predictors can be measured at the student level (eg. gender, SES, age) or the school level (enrollment, % who go on to college). The dependent variable has variation from student to student (level 1) and from school to school (level 2).
We always count these levels from the bottom up. So if we have students clustered within classroom and classroom clustered within school and school clustered within district, we have:
- Level 1: Students
- Level 2: Classroom
- Level 3: School
- Level 4: District
So this use of the term level describes the design of the study, not the measurement of the variables or the categories of the factors.
Putting them together
So this is the truly unfortunate part. There are situations where all three definitions of level are relevant within the same statistical analysis context.
I find this unfortunate because I think using the same word to mean completely different things just confuses people. But here it is:
Picture that study in which students are clustered within school (a two-level design). Each school is assigned to use one of three math curricula (the independent variable, which happens to be categorical).
So, the variable “math curriculum” is a factor with three levels (ie, three categories).
Because those three categories of “math curriculum” are unordered, “math curriculum” has a nominal level of measurement.
And since “math curriculum” is assigned to each school, it is considered a level 2 variable in the two-level model.
See the rest of the Confusing Statistical Terms series.
First published December 12, 2008
Last Updated January 21, 2025